
If you wish to land top data science jobs and are wondering how to crack interviews well, you are in the right place. Data science is one of the hottest fields right now with many organizations racing to hire talent that can turn raw numbers into actionable business insights. But it is not easy to get into this high-demand field in top companies like FAANG-level or startups or even at major tech hubs. And the answer to cracking these tough interviews is only preparation.
This guide will take you through the most important and most asked questions in data science interviews from beginner, intermediate to senior level. Along with the answers and preparation tips etc that will assist you with the interview preparation journey.
Data Science Questions At a Glance
Below you will find about 20 top questions commonly asked in data science interviews along with answers and tips on how to prepare and perform to ace your interviews well. The questions are also divided into beginner, intermediate and advanced levels that allows for a streamlined way of preparing for your
Beginner/Fresher Level Data Science Interview Questions
Below you will find about 20 top questions commonly asked in data science interviews along with answers:
1. What is the difference between structured and unstructured data?
-
Structured Data: The predefined format of structured data requires its organization into rows and columns which enables efficient data storage, searching and analysis. The data set has a structured organization that contains measurable data that adheres to a predetermined framework. The data type is stored in relational databases which use SQL for its data management. Machines can process structured data because its clear structure provides them with an easy processing path which leads to successful analysis.
- Unstructured data: This type of data does not follow a predefined structure or schema, which makes its storage and processing and analysis more difficult to accomplish. The data typically exists in different formats, which include text and images and audio and video and log files. Unstructured data extraction becomes more difficult because it does not have a standard structure, which requires advanced techniques such as natural language processing and computer vision and machine learning to extract valuable insights from the data.NoSQL databases and non-relational data stores represent the common storage methods for unstructured data. The additional storage requirements of the data create security and data management issues.
Example: The database stores customer information through the structured data format, which includes customer_id and name and age and purchase_amount as table columns. The different types of unstructured data include emails and social media posts and call recordings and images and videos and satellite imagery and sensor data.
|
Difference Between Structured & Unstructured Data | ||
|
Parameters |
Structured data |
Unstructured data |
|
Format |
Organized, typically in tables or databases |
No predefined format lacks structure |
|
Schema |
Follows a predefined schema |
No fixed schema, flexible |
|
Storage |
Easily stored in databases or spreadsheets |
Requires specialized storage solutions |
|
Retrieval |
Simple and straightforward |
Often requires advanced search algorithms |
|
Analysis |
Well-suited for quantitative analysis |
Requires specialized techniques (NLP, etc.) |
|
Processing |
Easily processed using traditional methods |
Requires advanced processing techniques |
|
Complexity |
Low complexity due to structured format |
High complexity due to lack of structure |
|
Size |
Typically smaller in size |
Can be larger due to multimedia content |
|
Insights Extraction |
Straightforward extraction of insights |
Requires sophisticated analysis methods |
|
Database Management |
Easily managed with traditional DBMS |
May require NoSQL or other specialized DBMS |
|
Searchability |
Highly searchable using SQL queries |
Less searchable, often relies on metadata |
|
Examples |
Databases, spreadsheets, CSV files |
Text documents, emails, images, videos |
2. Explain mean, median, and mode with examples
- Mean: The mean is the average of a dataset. It is calculated by adding all the values and dividing by the total number of values. The mean gives an overall central value of the data but can be influenced by extreme values (outliers).
- Median: The median is the middle value when the data is arranged in ascending or descending order. If the dataset has an even number of values, the median is the average of the two middle numbers. The median provides a beneficial measurement because it remains stable when extreme values in both directions are present.
- Mode: The most frequently appearing value in a dataset is called the mode. A dataset can have one or more than one mode, or no mode. When there is only one mode it is known as unimodal and in case of more than one, it is referred to as bimodal or multimodal. A dataset usually has no mode if all values happen to be in the same frequency.
- Standard Deviation: Standard deviation measurements show how much distance data values move away from their average value. The data set demonstrates minor variation when its standard deviation value remains low because its data points cluster near the mean. The data set demonstrates high variability when its standard deviation value reaches high values.
Example:
- This is a dataset: 2, 4, 4, 6, 8
- Mean = (2 + 4 + 4 + 6 + 8) / 5 = 4.8
- Median = 4 (middle value)
- Mode = 4 (most frequent value)
- Standard deviation shows how much the values differ from the mean.
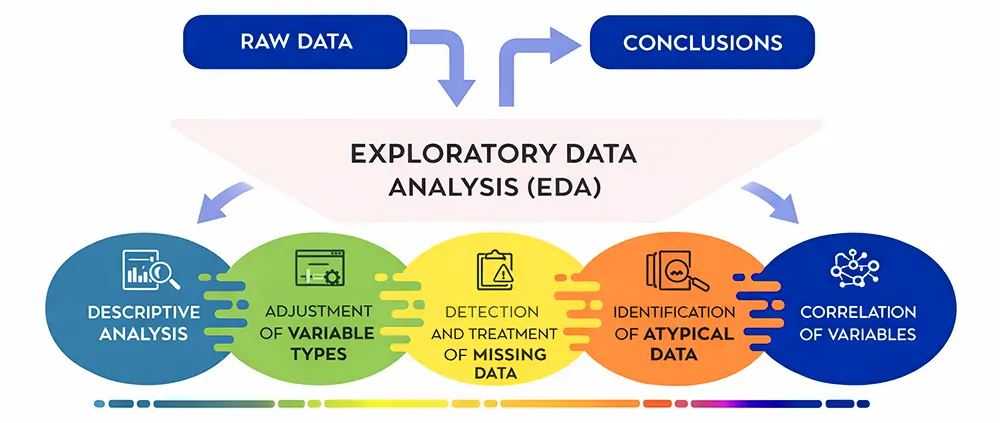
3. What is exploratory data analysis ?
Exploratory data analysis serves as the initial stage for understanding a dataset through its complete analysis before researchers begin using machine learning techniques. The process uses statistical methods together with visual tools to present the key features of data, which enables researchers to discover patterns and trends and detect anomalies and study how different variables interact with one another.
Data scientists use EDA to study how data distributes across different values while they search for missing data and incorrect information and outlier detection and feature correlation analysis. In Python, developers use Pandas and NumPy and Matplotlib and Seaborn as their main tools to perform this task.
Example: The data scientist uses EDA to study customer demographics and usage patterns and subscription history before creating a customer churn model to discover which elements lead to churn.
4. Differentiate between classification and regression.
Supervised machine learning problems use classification and regression as their two main categories because these two methods deal with different types of target variables. Classification is used when the output variable is categorical. The model classifies input data into specific categories, which include "spam or not spam" and "fraud or non-fraud" and "yes or no." The most widely used classification algorithms include logistic regression and decision trees and random forests and support vector machines.
Example: Regression enables users to predict numerical values that exist on a continuous scale which includes applications like predicting house prices and sales revenue and temperature. The most commonly used regression algorithms include linear regression and ridge regression and Lasso and SVR.
5. What is the Central Limit Theorem?
The Central Limit Theorem shows that when you select a random sample which meets the minimum size requirement from any population, the sample mean distribution will become approximately a normal distribution, which has a bell-shaped curve, and this will happen regardless of the actual population distribution. This condition holds true when the sample size reaches 30.
The CLT enables statisticians and data scientists to use sample statistics for estimating population parameters, which occurs when data does not follow a normal distribution.
Example: When you sample 50 customers from a population and compute their average purchase amount, the resulting sample averages will form a normal distribution even though customer purchase amounts display a skewed pattern.
6. Define correlation vs causation
|
Correlation vs Causation | ||
|
Aspect |
Correlation |
Causation |
|
Definition |
Measures strength and direction of the linear relationship between two variables. |
One variable directly causes changes in the other. |
|
Implication |
Variables tend to move together (positively or negatively), but no cause implied. |
Direct effect proven via experiments or strong domain-specific evidence. |
|
Example |
Ice cream sales and drowning rates both rise in summer (spurious). |
Smoking causes lung cancer (established experimentally). |
Example: Ice cream sales and drowning incidents may be correlated because both increase during summer. Ice cream sales do not cause drowning because hot weather functions as the main reason behind this relationship.
7. How do you handle missing values in a dataset?
The process of handling missing values requires assessment of three factors, which include data characteristics and missing data volume and analysis effects and modeling requirements. The three standard methods for handling missing data include deleting the data that is not present, estimating the missing information, and treating missing data as an independent category.
Deletion: When missing data occurs in minimal amounts through random patterns, the process involves deleting complete rows or columns that contain missing information. The process of imputation involves replacing missing data through methods that include mean, median, mode, forward/backward fill, and advanced techniques such as regression and KNN imputation. The process of categorical handling involves creating a new category that represents missing categorical information through the designation of "Unknown" status. The process of model-based methods uses algorithms which possess the capability to process missing data.
Example: You should use the median age value to replace missing data in the Age column. The system will delete a column when its missing data exceeds a specific threshold.
Intermediate-Level Data Science Interview Questions
8. What is the bias-variance tradeoff?
- Bias: When a model uses simple design because it fails to identify actual data patterns, it creates bias. The use of a straight line to model a curved relationship produces consistent errors that affect both training data and new data.
- Variance: When a model uses excessive complexity, it becomes unable to function correctly because it reacts too strongly to minor changes in its training material. It is able to capture noise and not general patterns. So, it excels well with training data and not on unseen data.
- Tradeoff: The bias-variance tradeoff shows how two types of errors combine to create total error. The U-shaped total error curve shows that model complexity rise leads to decreased bias and increased variance. The optimal model lies at the minimum point, found through techniques like cross-validation.
Example: High bias results from using a linear model to analyze data that has a nonlinear relationship. A high-degree polynomial fits training data perfectly but shows high variance on test data. A moderately complex model achieves the best balance.
9. Explain overfitting and underfitting in machine learning
- Overfitting: It happens when a model learns both the important data patterns and the random data errors in its training dataset. The system reaches optimal performance during training sessions but fails to perform well with new data because its design exceeds what the dataset can support.
- Underfitting: This occurs when a model requires more complex structure to identify the fundamental data patterns. The system fails to give acceptable results for both training and testing as the underlying assumptions do not match with the actual data distribution.
- Detection & Mitigation: Learning curves help identify issues such as overfitting or underfitting. For instance, overfitting shows low training error but high test error and underfitting shows high error on both. The solution to overfitting requires methods such as regularization and pruning and data augmentation. Underfitting requires the development of more advanced models together with superior methods of feature development.
Example: A decision tree without depth limits creates training point rules which lead to overfitting problems. A single-split tree underfits complex patterns. The pruned tree reaches its highest performance level at the controlled depth.
10. What is a confusion matrix and its metrics (precision and recall)?
- Confusion Matrix: The confusion matrix serves as a two-dimensional learning tool which displays actual class data through its horizontal rows while its vertical columns show predicted class information. The system has four components, which are
- True Positives:
- True Negatives
- False Positives
- False Negatives
- Key Metrics: Precision calculates the ratio of true positives to the total of true positives and false positives because this metric shows the accuracy of positive predictions, which becomes crucial when false positive results become expensive. Recall calculates the ratio of true positives to the total of true positives and false negatives because this metric shows the success rate of identifying actual positive cases, which becomes essential when missing positive cases leads to severe results. The F1-score provides their harmonic mean for balanced evaluation.
Example: The fraud detection system shows precision at 71% and recall at 83% because it detected 50 true positive cases while it made 20 false positive errors and 10 false negative mistakes and had 920 true negative results.
11. Describe logistic regression and its use cases
- Logistic Regression: Logistic regression models binary outcomes by applying the sigmoid function to linear combinations of features, which results in probability values that range from 0 to 1. The method uses maximum likelihood optimization to determine its parameters.
- Key Characteristics: The model establishes log-odds relationships through a linearity assumption while using regularization techniques to manage multicollinearity issues. The model generates odds ratios through its coefficients, which enables users to understand its results.
- Use Cases: Common applications include customer churn prediction and medical diagnosis and spam detection and credit risk assessment which require transparent probability predictions.
Example: Logistic regression predicts exam success from study hours through a probability range that starts near 0% with low hours and reaches near 100% with high hours, while exam success decision-making occurs at the 50% probability point.
12. Differentiate between univariate, bivariate, and multivariate analysis
- Univariate analysis: It uses histograms and summary statistics to study a single variable which shows its distribution and central tendency and dispersion and shape.
- Bivariate analysis: It studies the relationship between two variables through three methods which use scatter plots and correlation coefficients and contingency tables to display results according to their respective variable types.
- Multivariate analysis: Multivariate analysis uses principal component analysis and clustering methods to study how three or more variables interact with each other to reveal hidden patterns.
|
Comparison Table | |||
|
Analysis Type |
Variables |
Common Tools |
Purpose |
|
Univariate |
1 |
Histograms, box plots |
Distribution characteristics |
|
Bivariate |
2 |
Scatter plots, correlations |
Variable relationships |
|
Multivariate |
3+ |
PCA, heatmaps, clustering |
Interaction patterns |
Example: Univariate analysis shows age distribution; bivariate analysis reveals age-income correlation; multivariate analysis segments customers by age, income, and education.
13. What is the difference between supervised and unsupervised learning?
- Supervised Learning: Supervised learning uses labeled training data with input-output pairs to learn predictive functions. The method applies two approaches which are regression for continuous outcomes and classification for discrete categories.
- Unsupervised Learning: Unsupervised learning discovers patterns in unlabeled data through clustering and dimensionality reduction and association rule mining because it does not use predefined targets.
|
Supervised vs Unsupervised Learning Comparison Table | ||
|
Aspect |
Supervised Learning |
Unsupervised Learning |
|
Data Requirement |
Labeled data |
Unlabeled data |
|
Objective |
Prediction |
Pattern discovery |
|
Examples |
Regression, classification |
Clustering, PCA |
|
Evaluation |
Holdout accuracy |
Internal validation metrics |
|
Labeling Cost |
High |
None |
Example: Supervised learning trains a spam filter using labeled emails; unsupervised learning clusters customer transaction data to identify spending patterns.
Advanced Level Data Science Interview Questions
14. What is a p-value in statistics?
The p-value serves as a statistical tool that calculates the likelihood of obtaining results that match or exceed the actual results observed in your sample when the null hypothesis stands true. The strength of evidence against the null hypothesis becomes quantifiable through this measurement.
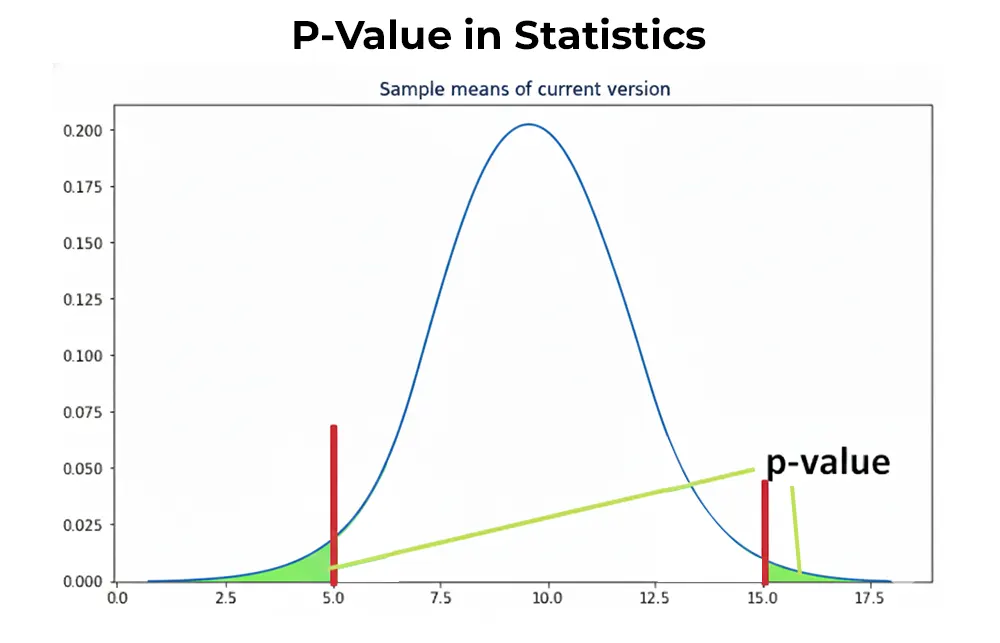
- Interpretation: Set significance level α (typically 0.05). If p-value < α, reject null hypothesis. If p-value ≥ α, insufficient evidence exists to reject the null hypothesis.
- Common Misconception: p-value ≠ probability that null hypothesis is true. It measures data compatibility with null hypothesis assumption.
Example: The drug effectiveness test results in a p-value of 0.03. The null hypothesis of "no effect" gets rejected because 0.03 functions as a boundary which proves the drug probably has an effect.
15. What are eigenvalues and eigenvectors?
- Eigenvectors: Special vectors maintaining direction (only scaling in magnitude) when multiplied by matrix. Represent principal directions of data transformation.
- Eigenvalues: Scalar multipliers indicating the stretch/shrink factor along corresponding eigenvector.
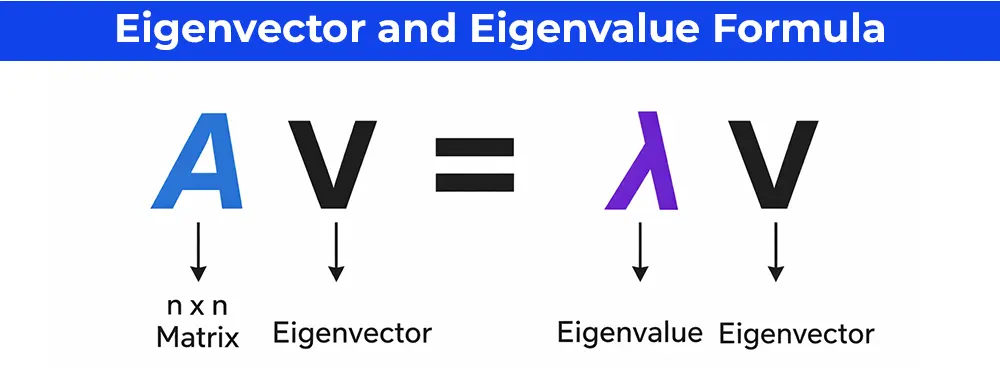
Example: Customer dataset—The first eigenvector (PC1) captures 80% variance along the "age + income" direction; eigenvalue λ₁ = 80.
16. Difference between CNN and RNN
- Convolutional Neural Networks: Designed for spatial hierarchy data. Convolutional layers detect local patterns (edges → shapes → objects) using shared weights. Pooling reduces dimensions.
- Recurrent Neural Networks: Built for sequential data. Hidden states maintain memory across time steps. LSTM/GRU variants solve vanishing gradients.
|
CNN vs RNN | ||
|
Characteristic |
CNN |
RNN |
|
Data Structure |
2D/3D grids (images) |
Sequences (text, time) |
|
Key Operation |
Convolution |
Recurrence |
|
Memory |
None |
Maintains state |
|
Applications |
Computer vision |
NLP, forecasting |
Example: CNN classifies cat photos; RNN predicts stock prices from historical data.
17. Explain Type I and Type II errors in hypothesis testing
- Type I Error (False Positive): Incorrectly rejecting a true null hypothesis. Probability = α (significance level, typically 0.05).
- Type II Error (False Negative): Failing to reject a false null hypothesis. Probability = β. Power = 1 - β.
- Tradeoff Relationship: Lowering Type I error (smaller α) increases Type II error. Larger sample sizes reduce both errors.
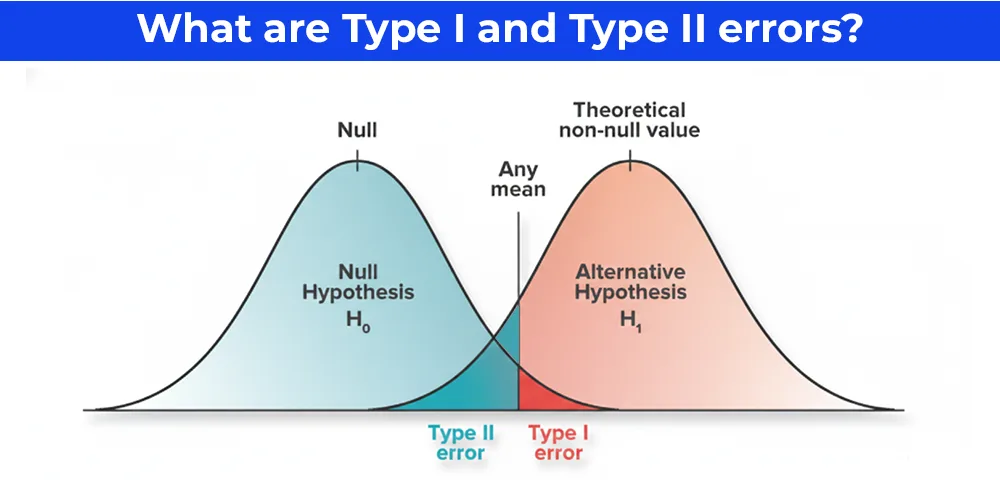
- Business Examples: Fraud Detection: Type I (flag innocent) costs little; Type II (miss fraud) costs millions
- Drug Approval: Type I (approve ineffective) dangerous; Type II (miss effective) delays treatment
Example: α = 0.05, β = 0.20: 5% chance of false alarm, 20% chance of missing real effect.
18. What are Artificial Neural Networks, and which architectures generate synthetic data?
- Artificial Neural Networks: Artificial neural networks duplicate brain neuron functions through their multiple interlinked node layers. The system accepts input which gets processed through weighted connections that the system trains with backpropagation to achieve minimal error during classification and prediction tasks.
- Key Generative Architectures
- Generative Adversarial Networks:The system operates through two networks which battle each other because the generator produces fake data while the discriminator identifies those fakes. The generator keeps improving until it produces fake content which human observers cannot differentiate from real stuff. The method works best when applying it to high-quality visual content that includes human faces and artistic creations.
- Variational Autoencoders: The encoder transforms data into latent space while the decoder performs data reconstruction. The system generates new variations through latent space sampling. The system works best with structured data which includes both customer profiles and medical images.
- Diffusion Models: The system starts with data which it progressively transforms by adding noise until it reaches a point where it trains to reverse the noise removal process. The system produces high-level visual content through its two applications Stable Diffusion and DALL-E 3.
- Autoregressive Models: Then predict the next data point from the previous sequence. Perfect for text or time series.
|
Comparison Table | ||
|
Architecture |
Best For |
Stability |
|
GANs |
Images |
Unstable |
|
VAEs |
Tabular data |
Stable |
|
Diffusion |
SOTA images |
Stable |
|
Autoregressive |
Sequences |
Stable |
Business Use/Example: Generate privacy-safe synthetic data for training, augment rare cases, test edge scenarios.
19. What is Feature Engineering? Explain the different feature engineering methods.
- Feature Engineering: Feature engineering involves selecting, creating, and transforming raw data to extract useful features which enhance machine learning model performance. It transforms raw data into valuable model inputs through its ability to identify important features while decreasing irrelevant data and tracking essential data patterns.
- Feature Creation: Feature creation produces new data features by using current data to create interaction terms and polynomial features and domain-specific derived features which include time-series data aggregation into average and ratio time-series data.
- Feature Transformation:Feature transformation uses mathematical operations which include scaling through normalization or standardization and logarithmic transformations and binning to manage skewness and outliers and different measurement scales.
- Handling Missing Values: Handling missing values involves using imputation techniques which include mean/median filling and forward/backward fill for time series and KNN imputation to maintain data completeness.
- Categorical Encoding: Categorical encoding converts non-numeric data into format suitable for algorithms through one-hot encoding and label encoding and target encoding and embeddings.
- Feature Selection: Feature selection establishes relevant features through three methods which include filter methods based on correlation and chi-square and wrapper methods based on recursive elimination and embedded methods.
- Dimensionality Reduction: Dimensionality reduction uses PCA and LDA and t-SNE to reduce high-dimensional data while preserving its essential variance and crucial data points.
Example: The process of feature engineering creates customer data features through the development of "days_since_last_purchase" timestamp feature which combines one-hot encoding for regional data and standardization for income scaling to create an accurate churn prediction model.
20. Tips & Skills to Establish Yourself in Data Science Field
Data science is a domain with a lot of demand and it is important to establish oneself to have a chance at acing data interviews for good positions in top companies in the market. For this, you also want to acquire certain data science skills, so here are some tips for you all:
- Master Data Science Fundamentals: Data science fundamentals should be at your fingertips. This is very crucial for a solid career in the data science domain. Make sure you are clear about core concepts like statistics, probability, SQL, and Python before you learn advanced concepts.
- Build on Your Soft Skills: In data science, some skills like problem solving, strong communication skills. The method gives people an advantage which helps them compete better against their rivals.
- Practice Real-World Case Studies & Build a Portfolio: Data aspirants should have ample practical application scenarios where they work with data science case studies. Also, it's better that you have 2-3 projects or build a portfolio that you can showcase, as it helps you stand out from the other professionals who are aiming for top data science job positions.
- Prepare For Behavioral Questions: Interviewers might ask for questions around teamwork, deadlines, and stakeholder alignment. So, you should prepare for these questions in advance to crack your interviews well, especially when applying for executive-level roles.As discussed above, you can gain the skills mostly required in the data science domain with the below courses with data science specialization. Students through these programs are able to gain knowledge on the latest knowledge in data and also be updated with changes in the AI era:
|
Top Courses to Gain Latest Data Science Skills | |
Conclusion
The data science market has much potential right now and in the near future. With many individuals trying to secure their job and build sustainable careers, data jobs stand out as any amazing choice for IT, finance, e-commerce industry people with the related skills. Moreover, to be able to land high paying data science jobs at top companies, aspirants need to crack these tough interviews. And the above guide will guide you through the preparation.